Working across Fremont, we see a clear difference between the sandy alluvial deposits near the bay and the denser claystone formations found toward the Mission Hills. A site response analysis in Fremont must account for these contrasts, since loose granular soils can amplify long-period earthquake waves far more than stiff bedrock. Before running the full wave propagation model, we often recommend a [MASW survey](/masw-vs30/) to map shear-wave velocity profiles across the property, giving us a reliable VS30 value for the NEHRP site class. The deeper, softer layers near the marshes demand particular attention because they can trap seismic energy, and the local building code expects a site-specific ground motion analysis for any structure in Seismic Design Category D or higher.
Soft bay mud in Fremont can amplify peak ground acceleration by up to 1.8 times compared to rock sites, per ASCE 7 site class definitions.
Methodology and scope
Fremont sits within the East Bay seismic zone, where the Hayward and Calaveras faults generate ground motions that interact uniquely with the region's sedimentary basins. Our lab runs the site response analysis using equivalent-linear and fully nonlinear methods, depending on the strain level expected during the design earthquake. The procedure involves:
Collecting undisturbed samples for resonant column and cyclic triaxial tests
Correlating SPT blow counts from boreholes with empirical modulus reduction curves
Running SHAKE or DEEPSOIL models with input motions scaled to the USGS hazard deaggregation
Since the water table sits shallow near the bay, we also check for pore-pressure buildup during shaking. Complementing this with a deep soil mixing study helps when the design calls for ground improvement to reduce amplification.
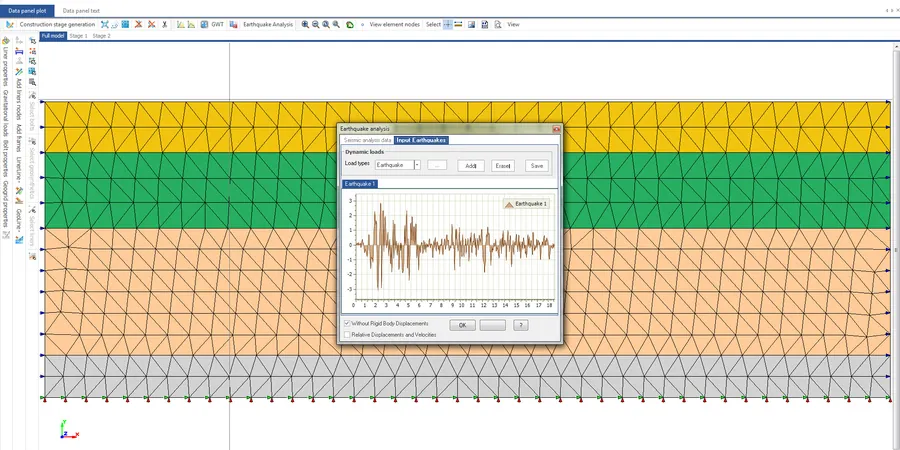
Technical reference image — Fremont
Local considerations
A common oversight we encounter in Fremont is assuming uniform soil response across a parcel that straddles both fill and natural alluvium. The transition zone can create a stiffness contrast that focuses shear waves into a narrow band, producing localized amplification well above the average. If the analysis uses a single VS30 value for the whole footprint, the design may underestimate the demand on a corner of the foundation. That is why we always run multiple soil columns across the site and compare the response spectra before signing off on the final design parameters.
Seismic coefficient (k_h) for pseudo-static slope analysis
0.15 – 0.25 depending on site class
Associated technical services
01
Shear-Wave Velocity Profiling (MASW & ReMi)
We deploy surface-wave arrays to measure VS30 across the site, using multichannel analysis of surface waves and refraction microtremor. This gives us a continuous 1D or 2D velocity model without requiring boreholes, ideal for sites with sensitive access constraints.
For critical structures, we extract thin-walled tube samples and test them in a resonant column device to obtain G/Gmax and damping curves at low strains, plus cyclic triaxial tests for liquefaction resistance under undrained loading.
What is the difference between a site response analysis and a standard seismic hazard study?
A seismic hazard study calculates the ground motion at the bedrock level from fault sources. A site response analysis then propagates that motion through the soil column above, accounting for amplification, attenuation, and resonance caused by the local stratigraphy. In Fremont, the soft alluvium can double the spectral acceleration at certain periods, so skipping the site response step may underestimate the actual shaking at the surface.
When is a site response analysis required by the Fremont building code?
The City of Fremont adopts the California Building Code, which references ASCE 7. A site-specific ground motion procedure is mandatory for structures in Seismic Design Category D, E, or F, or when the soil profile contains more than 3 meters of soft clay with plasticity index greater than 20. For tall buildings or those with an irregular vertical frame, the analysis is also required to develop the design response spectrum.
What soil parameters do you need from the geotechnical investigation to run the analysis?
We require the shear-wave velocity profile (VS30), unit weight, thickness of each layer, and strain-dependent modulus reduction and damping curves. For cohesive layers, we also need the undrained shear strength and plasticity index to estimate the G/Gmax relationship. If liquefaction is a concern, the cyclic resistance ratio from SPT or CPT correlations is needed to model pore-pressure generation.
How much does a site response analysis cost in Fremont?
For a typical commercial project with two to four soil columns and bedrock input motions from the USGS database, the cost ranges between US$1,160 and US$3,750. The final price depends on the number of profiles, the complexity of the soil layering, and whether we need to run nonlinear time-history analyses versus equivalent-linear methods.